Big Data and analytics technologies enable your organisation to become more competitive and grow without limit, thanks to the four V’s of Big Data. This, in combination with specific solutions for its analysis, such as an Intelligent Data Lake brings a lot of value to a company. Let’s dive into it:
What is big data?
Having a big data strategy in place means: capturing, storing, twisting, polishing, presenting and apprehending large amounts of information unique to each organization, in order to make business decisions.
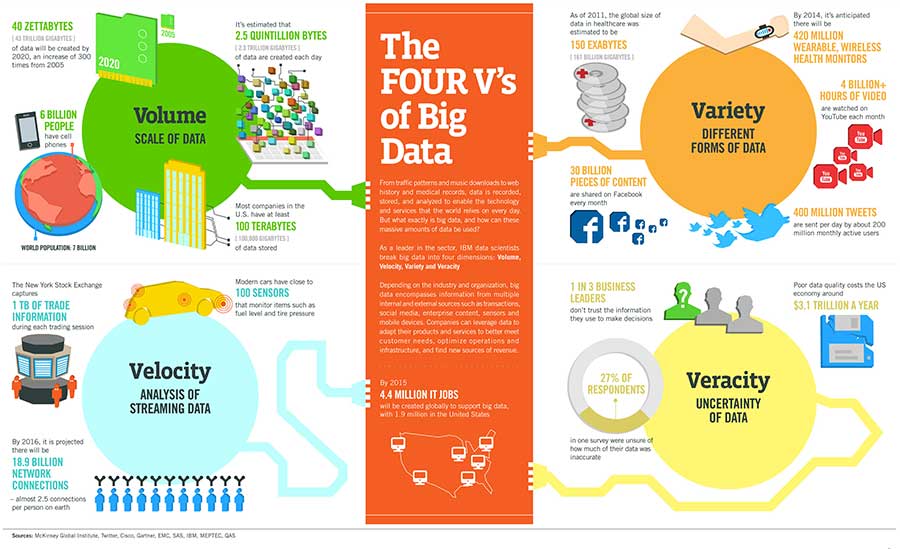
The 4 V’s of Big Data in infographics
The term is not new. For many people this term is directly associated with “a lot of data”. Understanding this technology in this way, however, is not entirely accurate. Big Data technology implies:
- Compilation.
- Storage.
- Exploitation.
…of a large volume of data. However, this does not necessarily mean that we are talking about “Big Data”.
IBM data scientists break it into four dimensions: volume, variety, velocity and veracity. This infographic explains and gives examples of each.

The 4 V’s of Big Data
It can be said that the Big Data environment has to have these four basic characteristics:
Volume
You may have heard on more than one occasion that Big Data is nothing more than business intelligence, but in a very large format. More data, however, is not a synonym of it.
Obviously, the Big Data, needs a certain amount of data, but having a huge amount of data, does not necessarily mean that you are working on this field of data.
It would also be a mistake to think that all areas of Big Data are business intelligence since is not limited or defined by the objectives sought with that initiative. But it will be by the characteristics of the data itself.
Variety
Today, we can base our decisions on the prescriptive data obtained through this method. Thanks to this technology, every action of customers, competitors, suppliers, etc, will generate prescriptive information that will range from structured and easily managed data to unstructured information that is difficult to use for decision making.
Each piece of data, or core information, will require specific treatment. In addition, each type of data will require specific storage needs (the storage of an e-mail will be much less than that of a video).
Veracity
This V will refer to both data quality and availability. When it comes to traditional business analytics, the source of the data is going to be much smaller in both quantity and variety.
However, the organization will have more control over them, and their veracity will be greater.
When we talk about the Big D, variety is going to mean greater uncertainty about the quality of that data and its availability. It will also have implications in terms of the data sources we may have.
Velocity
It is very possible that Variety and Veracity would not be so relevant and would not be under so much pressure when facing a Big Data initiative if it were not for the high volume of information that has to be handled and, above all, for the velocity at which the information has to be generated and managed.
The data will be an input for the technology area (it will be essential to be able to store and digest large amounts of information). And the output part will be the decisions and reactions that will later involve the corresponding departments.
The important thing here is that they are able to react with the necessary speed to boost the business area.

To the traditional 4 V’s of Big Data we can add another 3 V’s that are also fundamental in big data technology:
The value of data
The importance and the possible benefit that can be obtained from the data is one of the fundamental factors of this technology.
The value that can be obtained from the data depends on many factors, among others the use that is made of it or the combination that is made between the data itself to get the most out of them.
Data visualization
Data visualization is the way in which data is represented for display and explanation to facilitate understanding and decision making. In addition, data visualization tools make data more accessible and understandable and help to find problems and patterns.
Data Feasibility
This refers to the ability of companies to make effective use of the data they collect. In other words, there is no point in having a large amount of data if the information they provide is not used efficiently.


