The usual thing in a project is that everything starts with a challenge, but in the case of Data projects there is a pain that usually weighs more heavily: Not being able to obtain knowledge of the data in custody in a short time is a loss of important opportunities, both of the data itself and of the technological options possible to use.
Building the Data Culture
From the point of view of data science knowledge is obtained by applying algorithmic techniques on a dataset and then showing the results obtained in the form of an article, but the life of a dataset is a complex process; especially if we are the ones who have cured it. The life of a dataset includes implementing everything from data ingestion, validation, duplicate elimination, anonymization or application of statistical secrets, to the formation of more reliable zones to finally “cure” a dataset that is in the best possible condition. The evidence shows that between 70% and 90% of the time of the data work is spent on data healing tasks (if you spend the day mostly between pandas, Drill or Spark shell you know what I mean).
A day in the life of a dataset
Where do we get our cured datasets from? Are we going to save information and then see what we do with it? or are we going to save data that we already know what to do with? Those who remember from Software Engineering – of course they will understand that – the Use Case here is diffuse, I don’t know if it is required to a client to have a use case about a data asset that can produce unknown results, many times organizations do data projects (and it is understandable) not only to extract information from the data, but to make an inventory of what data they capture or have.
Lessons learned from Data Lake Architectures
Suppose we get our data from a DataLake, this implies that a day in the life of a dataset is next: It captures as much data as it can from the digital assets under my control and then every day (or hour or week, it depends) I will treat the data increasing the confidence levels of it (classic example: eliminate duplicates, eliminate corrupted data), making them go through zones (bronze, silver, gold) and once I have the data about the highest confidence zone I will generate the datasets that will be input for the regression models, classification, etc.
Lesson learned 1: “The data & analytics ecosystem is not integrated
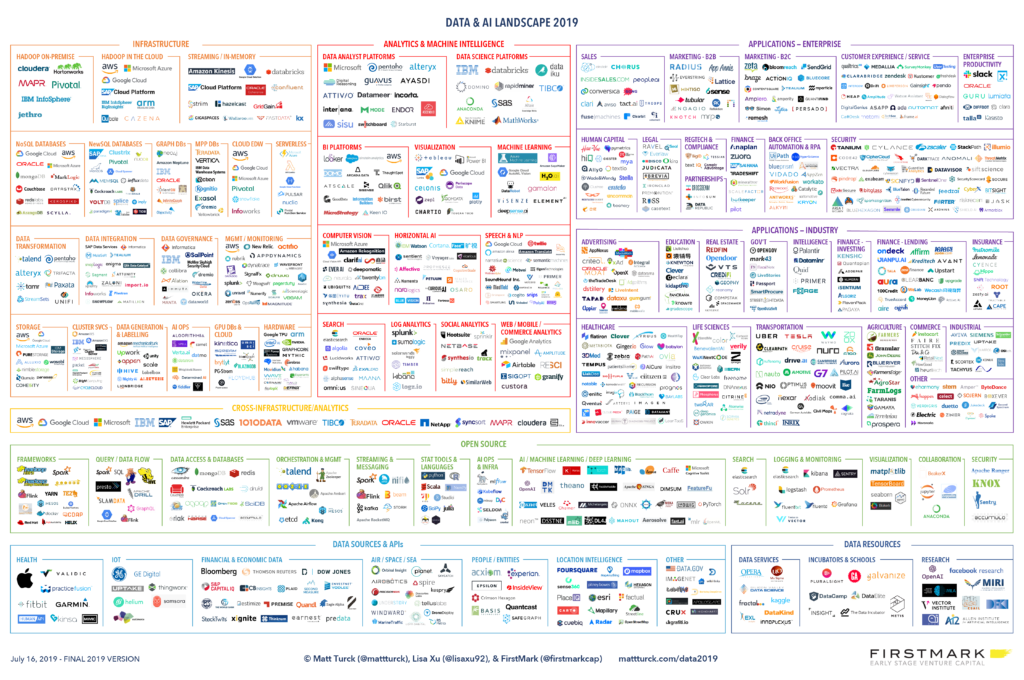
Curious fact: There is an online game called “Pokemon or big data”, where from the name of a supposed Big Data product you must guess which one is from each “Universe”.
There are hundreds, if not thousands of big data products and although there is a certain tendency, what we can be fairly sure of is that there are some products that will work well and others that will not, that we must study the products in depth and have executive support when it comes to promoting the implementation of any product.

There is no large Data & Analytics platform in sight (+ AI), I am not sure it will happen, in the same way that it did not happen with the software development process, in which case we see today that each “stack” is composed of several products with some matching products.
Here are my favorite Data & Analytics products as of June 2020, the ones that have never failed me and that I almost obligatorily put in the architectures:
- Kafka (Confluent Platform)
- Spark
- Airflow
- Flink
- Apache Drill (A great discovery)
- Jupyter
- PostgreSQL (Of course)
- Druid
- Dremium
- PowerBI
- ML Flow
- Delta.io or Apache Iceberg.
Lesson learned 2: “Quality is the quality of questions”
It involves the product team not only in providing data, but in being aware of the questions that the executives have over the knowledge generated: Sandwich technique, on the one hand the team with specific case questions and on the other hand the executives with more strategic questions. This approach will suggest an improved prioritization in the plans or invites you to improve the architecture to answer the questions.
Make events or presentations such as “Data show”, where data (or results generated by the models) are analyzed live in interactive sessions or from a visualization panel so that trends can be seen.
I learned this lesson after reading Hans Rosling’s wonderful “Factfulness
Lesson learned 3: “A project should be prepared for its BAU”
The projects are finished and the generated artifacts are implemented under the operation of other people (Operativize, could be a suitable word here), generate an operations manual of everything you are building because be clear that it will not be you or your team who operates in the medium/long term the artifacts you left implemented in this or that project.
- https://es.wikipedia.org/wiki/Conjunto_de_datos
- Ej.: https://www.linkedin.com/pulse/madrid-best-neighbourhoods-raise-family-leonardo-barrientos-c
- https://pixelastic.github.io/pokemonorbigdata/
- A Turbulent Year: The 2019 Data & AI Landscape
- https://www.amazon.es/Factfulness-Reasons-World-Things-International/dp/1250107814


